Appearance
Options simulator — user guide (sample)
This is a sample for review. It has the intro, the outline of the whole guide and one finished section, "Your first replay". The other sections are written once the structure, tone and screenshot style are approved.
The Options simulator lets you go back to a past trading day of an Indian index (NIFTY, BANKNIFTY, FINNIFTY, MIDCPNIFTY, SENSEX or BANKEX) and trade its options as if you were there. You set a clock to a minute of that day, buy or sell from the option chain at that minute's prices, then move the clock on and watch your positions gain or lose.
It is a replay of recorded prices, not a market:
- Nothing is ever ordered. No broker is involved.
- Every price is that minute's closing price for the option. There is no bid or ask, and no slippage, so real fills would have been a little worse.
- Past prices do not repeat. One good replay says nothing about the next session.
It is for anyone who wants to practise reading an option chain, try a strategy on a real day before risking money, or see how an expiry day actually played out, minute by minute.
Outline of the full guide
Sections are in the order a new user needs them. Each one lists what it covers and the screenshots it will carry.
- Open the simulator. Where it lives: the Backtest page, left rail, Tools → Options simulator (on a phone, the view picker at the top). What you see when it opens: the session bar on top, the option chain on the left, the summary and positions on the right. The page remembers your last session, clock and trades in this browser. Screenshot: the whole simulator as it first opens.
- Load a session and move the clock. Symbol (locked while you hold trades), Session with the previous and next arrows or the date picker (holidays and unrecorded days are refused), the market strip (Day open, the index and its move, the nearest future, the synthetic future, VIX), the time picker, the back buttons (SOD, −1h, −15m, −5m, −1m), the ahead buttons (+1m, +5m, +15m, +1h, EOD) and the slider. Why the clock cannot go back before your last trade, and how Clear session lets you start earlier. Screenshots: the session bar; a note shown when you try to go back.
- Read the option chain. Expiry strip (only expiries that traded that day) and the Lots field (× lot size), call and put LTP with open-interest bars behind them, the shaded in-the-money side, the highlighted ATM row, the IV column. Header figures: ATM IV, Straddle, PCR, Call vs put OI, Max pain, and why PCR, OI and max pain cover only the strikes loaded around the opening price. ATM on (Spot, Fut, Synth Fut) and Add ons (Delta, Call & Put IV, OI, Show all OI). Screenshots: chain with header; Add ons menu open; chain with OI columns on.
- Place your first strategy. Four ways in:
- Pre-built strategies (shown while nothing is open): Neutral, Bearish and Bullish tabs, the risk filter (All, Risk defined, Undefined risk) and the expiry picker.
- B / S on the chain: buy or sell one strike at a time; the buttons show on the row under the pointer.
- Import: From backtest templates, Delta focused templates with a delta picker, and strategies saved in the rule builder (only the first case is used).
- Strategy finder: filters (min reward ratio, min POP, max loss, expiry, OTM and ITM range, leg count, bias, rank by), the ranked table and Add. The limit of 12 open positions. Screenshots: pre-built cards; chain row with B/S; Import dialog; Strategy finder with results.
- Read the summary and analysis. The tiles: Total MTM, Max profit, Max loss, RR ratio, POP, Net credit or Net debit, Margin (an estimate, with its gross line), Breakeven, Delta, Theta, and the ⓘ on each. Tabs: Payoff (on-expiry and target-date curves, ±1SD and ±2SD, zoom, projected P&L) with Payoff settings (Change IV, Target on date and time, Change spot), Greeks (per leg and total), Target P&L (each leg on the target date). Screenshots: tiles; payoff; payoff settings open; Greeks; Target P&L.
- Manage positions. The Positions view (avg, LTP, P&L, exit one leg, closed legs greyed, realised and unrealised totals), Exit all, Clear session. Edit legs: Lots − / +, Strike − / + (a roll), Expiry (a roll to another expiry, which loads that chain first), Exit lots (partial exit), Analyse (keep a leg out of payoff and Greeks while it still counts in MTM) and the Multiplier with Apply ×N. Screenshots: Positions; Edit legs.
- Alerts. Per-leg Stop loss and Target in % or pts of the average price, with the level shown under them; Exit all when Total P&L or Total Delta crosses a value, up to two conditions joined by OR. Alerts are checked only at the minutes the clock lands on; a fired alert exits at that minute's price, notes why in Activity and pauses autoplay. Screenshots: Alerts view with a stop and a whole-position condition; the notice after one fires.
- Play it out. Stepping by hand versus Autoplay and its speeds (1m / 1s, 5m / 1s, 15m / 1s, 1m / 0.25s), Pause, Roll into next session (carries on into the next session at the close, up to today), and what happens to positions held past their expiry: they are settled at intrinsic value on the index's close when the next session loads. Screenshots: transport row while playing; the settlement notice.
- Charts. The Charts tab's four charts: MTM (the session's P&L by minute), Strategy (combined premium with the index, future, ATM straddle, VWAP, SMA(14), EMA(14) and per-leg chips, Invert price (Sell − Buy), zoom and pan, interval chips), Open interest (each open leg's OI or OI change against the index) and Rolling straddle (the ATM straddle as the ATM strike follows the index, with its call and put parts and an expiry picker). Why VWAP here is a running average. Screenshot: one per chart.
- Activity log. Every trade with time, side, instrument, lots, price and a note (alert, roll, settlement). Screenshot: Activity after a few edits.
- Driving it from chat. Ask Sena to replay a trade ("sell the 9:20 straddle on that Thursday and hold to the close"): the page loads the session and plays it visibly, with the Sena is replaying… Stop banner, then Undo (puts back what you had) and Dismiss. What the agent can do that the page has no button for: whole-plan replays of up to 24 steps, delta-neutral rebalancing that rolls a leg to keep delta inside a band, and reading the page's figures for you. Screenshots: banner while running; banner with Undo and Dismiss.
- Limits and caveats. One-minute closes only, no bid/ask or slippage; stops only on landed minutes; at most 12 open positions; indices only (no stock options, no futures trading); older sessions price only near expiries; margin is an estimate, not a broker's figure; PCR, OI and max pain cover only loaded strikes. No screenshot.
Your first replay
In this section you replay a real morning: you sell a NIFTY short straddle at 09:20 on 20 November 2026, read what the simulator tells you about it, then jump to 11:00 and see how it did. It takes about five minutes.
A straddle is a call and a put at the same strike. Selling one means you collect both premiums up front and profit if the index stays near that strike while time passes. You lose if the index moves far in either direction.
1. Set the session and the clock
Open the simulator from the Backtest page: Tools → Options simulator in the left rail.
- In Symbol, choose NIFTY.
- In Session, pick 20-11-2026. The page loads that day's recorded prices; the first time a day is opened this can take a few seconds.
- Press +1m four times, or choose 09:20 in the time picker, so the clock moves from the open (09:16) to 09:20.

The session bar at 09:20. Look at the NIFTY figure (25,456.00) and the clock (09:20): everything else on the page is priced at this minute.
The strip shows the market at the minute on the clock. Day open is the first trade of the day (25,368.00) and how far the index has moved since. The NIFTY figure is the index now, with its move from the previous day's close (−58.30, −0.23%). Fut 23 Nov is the nearest future, Synth fut is the future implied by the option prices, and VIX is India's volatility index.
2. Choose the expiry and lot size
In the option chain, click 23 Nov in the expiry strip. That is the nearest weekly expiry, so the options lose value quickly, which is what a seller wants.
Set Lots to 1. A lot is the smallest quantity you can trade; the "× 65" beside the field says one NIFTY lot was 65 units on this day. Prices in the chain are per unit, so your rupee P&L is the price change × 65 for each lot.
The row with the outlined strike is at the money (ATM): the strike nearest the index. At 09:20 that is 25450. The chain header shows the Straddle at 279.65: the 25450 call plus the 25450 put, which is what selling the straddle will bring in per unit.
3. Sell the straddle
While you hold nothing, the right-hand side shows Pre-built strategies.
- Stay on the Neutral tab (a straddle seller expects the index to stay put).
- Check that Expiry says 23 Nov.
- Click Short Straddle.
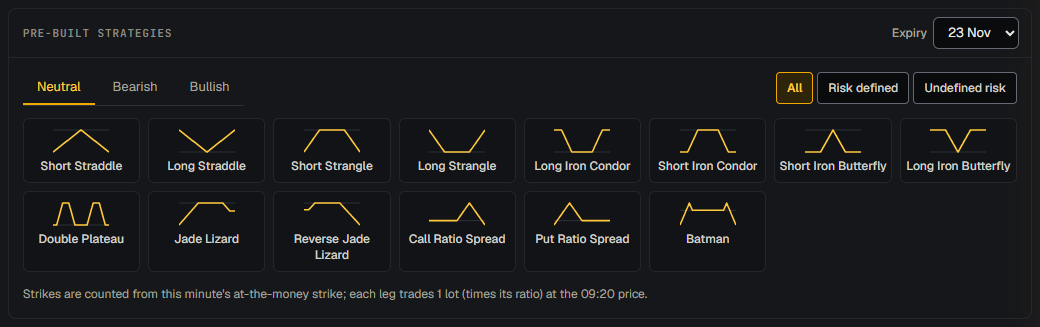
Pre-built strategies. Short Straddle is the first card on the Neutral tab; the line under the cards says strikes are counted from this minute's ATM.
The simulator picks the strikes around the ATM strike and fills each leg at the 09:20 price. Your Positions panel now shows two sold legs:
| Leg | Average price |
|---|---|
| S 23 Nov 25450 CE × 1 | 132.55 |
| S 23 Nov 25450 PE × 1 | 147.10 |
"S" means sold. Nothing was ordered anywhere: these are entries in the replay.
4. Read the tiles and the payoff
The tiles above the tabs sum up the position at this minute.
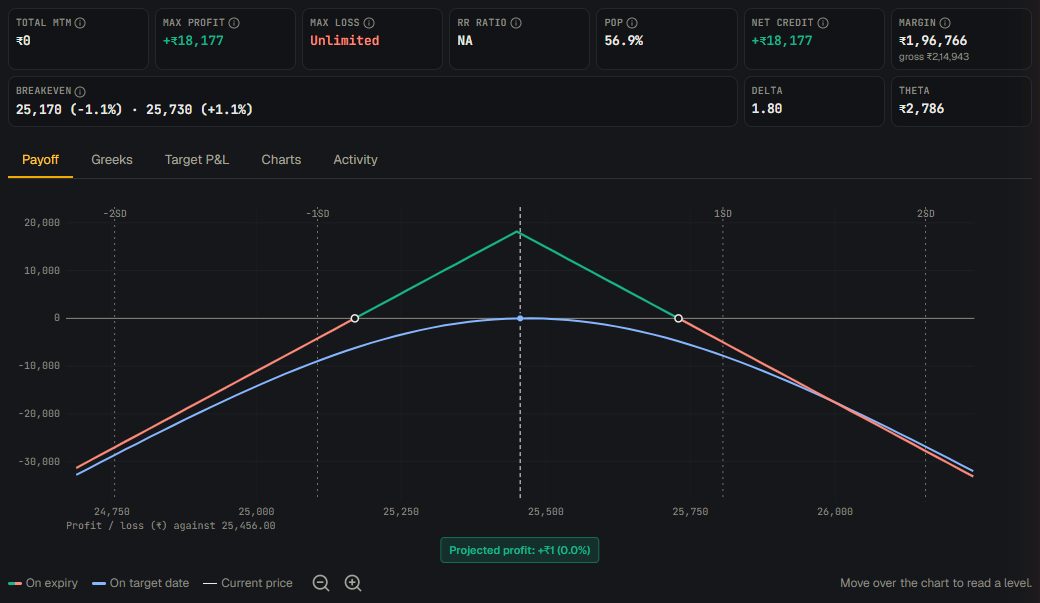
Just after the trade. Look at Net credit (+₹18,177), the two Breakeven levels and the tent-shaped payoff: profit in the middle, losses on both sides.
- Total MTM ₹0. MTM (mark to market) is your profit or loss if you closed everything at this minute's prices. You just traded at these prices, so it is zero.
- Net credit +₹18,177. What you collected: 279.65 × 65.
- Max profit +₹18,177. The most you can make, if NIFTY settles exactly at 25450 on expiry and both options expire worthless.
- Max loss Unlimited. A big enough move either way keeps costing you. This is why a short straddle is an "undefined risk" strategy.
- Breakeven 25,170 (−1.1%) · 25,730 (+1.1%). The index levels on expiry where you neither make nor lose money: the strike minus and plus the premium collected. Between them, you profit.
- POP 56.9%. Probability of profit: the estimated chance that NIFTY ends between the breakevens on expiry, from this minute's ATM volatility.
- Margin ₹1,96,766. An estimate of what a broker would block for this position, after the premium you received (the gross figure before that credit is in the small line under it). It is not a broker's number.
- Delta 1.80 and Theta ₹2,786. Delta is how much the position gains for each point NIFTY rises (here almost nothing, which is the point of a straddle). Theta is what time decay would earn you in a day if nothing else changed.
The Payoff chart draws the same story. The green and red line is your P&L on expiry at each NIFTY level (green where you profit, red where you lose), and its two circles are the breakevens. The blue line is the P&L at the target date, which by default is now. The dashed vertical line marks where NIFTY is, and the dotted lines labelled ±1SD and ±2SD show how far the index might typically move by expiry.
5. Move the clock to 11:00 and check the MTM
- Press +1h, then +15m twice and +5m twice. The clock lands on 11:00, and every price on the page moves to that minute.
- Click the Activity tab to see your two trades listed with their time and price.
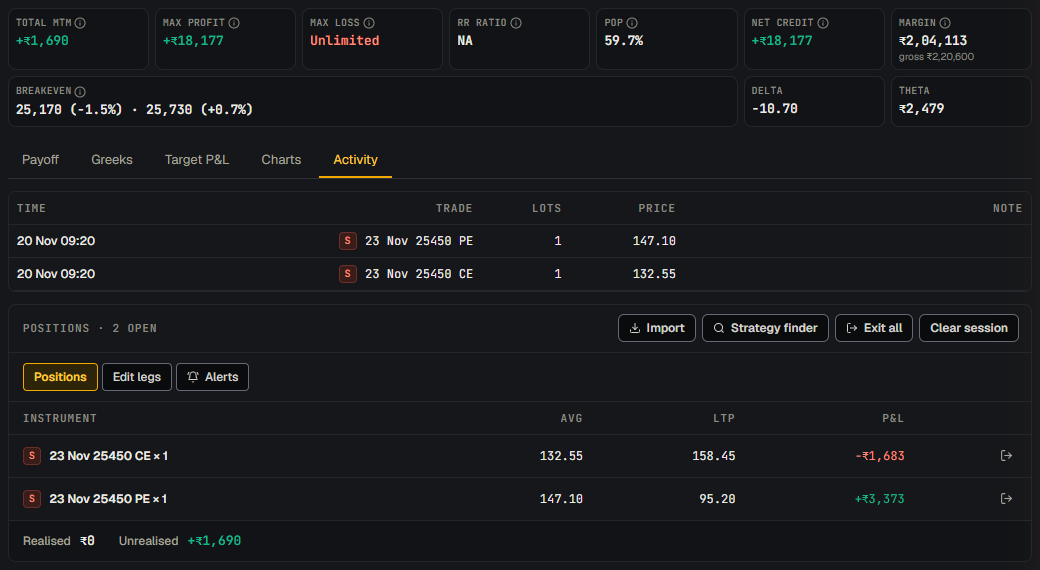
At 11:00. Look at Total MTM (+₹1,690) and the P&L column: the put has gained more than the call has lost.
NIFTY rose to 25,545.95, about 90 points above the strike. That move hurt the call you sold and helped the put:
| Leg | Average | LTP at 11:00 | P&L |
|---|---|---|---|
| S 25450 CE | 132.55 | 158.45 | −₹1,683 |
| S 25450 PE | 147.10 | 95.20 | +₹3,373 |
LTP is the option's last traded price at this minute. Together the legs are +₹1,690 (Total MTM, and Unrealised under the positions, because nothing is closed yet). The put lost more value than the call gained, partly because 100 minutes of time decay worked in your favour.
Notice how the tiles changed too: Delta is now −10.70, so the position now loses about ₹10.70 for every point NIFTY rises, and POP has moved to 59.7%.
6. What next
- Press Exit all to close both legs at the 11:00 prices and lock in the result, or keep stepping and see whether the gain survives the afternoon.
- Try Autoplay to let the clock run by itself (see Play it out).
- When you are done, press Clear session to remove every trade and start again from any minute.
Screenshots: NIFTY, session of 20 November 2026, 23 Nov expiry, 1 lot, ATM on Spot, desktop width (1920 px).